Monitoring AMS with Grafana
In this document, you'll learn how to monitor Ant Media Servers with Apache Kafka, Elasticsearch and Grafana. This is a step-by-step guide to install your monitoring system from scratch.
- Use Automatic Installation Script
- Install Apache Kafka
- Install Elasticsearch and Logstash
- Install Grafana
Information about CVE-2021-44228
Since Apache Kafka uses Log4j 1.x, there is no impact [1]. If your Logstash and Elasticsearch version is lower than 7.16.1, you can upgrade to the latest version with the command
apt-get update && apt-get install -y logstash elasticsearch. If you do not have the possibility to update, you need to add the parameter-Dlog4j2.formatMsgNoLookups=trueto the JVM option.[1] https://logging.apache.org/log4j/2.x/security.html
[2] https://discuss.elastic.co/t/apache-log4j2-remote-code-execution-rce-vulnerability-cve-2021-44228-esa-2021-31/291476
Which data can you access from Ant Media?
Ant Media Server provides the following statistics:
- instanceId
- cpuUsage
- jvmMemoryUsage
- systemInfo
- systemMemoryInfo
- fileSystemInfo
- jvmNativeMemoryUsage
- localWebRTCLiveStreams
- localLiveStreams
- localWebRTCViewers
- localHLSViewers
- encoders-blocked
- encoders-not-opened
- publish-timeout-errors
- vertx-worker-thread-queue-size
- webrtc-vertx-worker-thread-queue-size
- server-timing
- host-address
Automatic Installation Script
If you would like automatic installation instead of dealing with the steps above, you can use the script below:
Install Monitoring Tools through shell script for Ant Media Server
Usage:
-
Download the Installation Script
wget https://raw.githubusercontent.com/ant-media/Scripts/master/install-monitoring-tools.sh && chmod +x install-monitoring-tools.sh -
Run the Installation Script
sudo ./install-monitoring-tools.sh
After the installation is completed successfully, log in to the Web panel http://your_ip_address:3000/ through your web browser. The default username and password is admin/admin.
Install Apache Kafka
Kafka is useful for building real-time streaming data pipelines to get data between the systems or applications.
- Install Java because Apache Kafka requires Java.
apt-get update && apt-get install openjdk-8-jdk -y
- Download Apache Kafka and extract the archive file:
wget https://archive.apache.org/dist/kafka/2.2.0/kafka_2.12-2.2.0.tgz
tar -zxvf kafka_2.12-2.2.0.tgz
sudo mv kafka_2.12-2.2.0 /opt/kafka
- Edit server.properties:
vim /opt/kafka/config/server.properties
Add:
listeners=PLAINTEXT://your_server_ip:9092
- Start Apache Kafka:
sudo /opt/kafka/bin/zookeeper-server-start.sh /opt/kafka/config/zookeeper.properties &
sudo /opt/kafka/bin/kafka-server-start.sh /opt/kafka/config/server.properties &
First, ZooKeeper is started because Kafka needs ZooKeeper, then Kafka.
- Check if it's working:
netstat -tpln | egrep "9092|2181"
If the ports (9092 and 2181) are in listening mode, it’s working.
Run Apache Kafka as a systemd service
Running Apache Kafka as a systemd service lets us manage Kafka services with systemctl.
- Create a unit file for Apache Kafka:
vim /lib/systemd/system/kafka.service
Content:
[Unit]
Description=Apache Kafka Server
Requires=network.target remote-fs.target
After=network.target remote-fs.target kafka-zookeeper.service

[Service]
Type=simple
Environment=JAVA_HOME=/usr/lib/jvm/java-1.8.0-openjdk-amd64
ExecStart=/opt/kafka/bin/kafka-server-start.sh /opt/kafka/config/server.properties
ExecStop=/opt/kafka/bin/kafka-server-stop.sh

[Install]
WantedBy=multi-user.target
- Create a unit file for Zookeeper:
vim /lib/systemd/system/kafka-zookeeper.service
Content:
[Unit]
Description=Apache Zookeeper Server
Requires=network.target remote-fs.target
After=network.target remote-fs.target

[Service]
Type=simple
Environment=JAVA_HOME=/usr/lib/jvm/java-1.8.0-openjdk-amd64
ExecStart=/opt/kafka/bin/zookeeper-server-start.sh /opt/kafka/config/zookeeper.properties
ExecStop=/opt/kafka/bin/zookeeper-server-stop.sh

[Install]
WantedBy=multi-user.target
- Enable and reload systemd daemon:
systemctl enable kafka-zookeeper.service
systemctl enable kafka.service
- Start services:
systemctl start kafka-zookeeper.service
systemctl start kafka.service
Kafka settings for Ant Media Server
Edit the Kafka broker settings in AMS config:
vim /usr/local/antmedia/conf/red5.properties
Update the line:
server.kafka_brokers=ip_address:port_number
Example:
server.kafka_brokers=192.168.1.230:9092
Restart Ant Media Server:
service antmedia restart
Check if it’s working:
/opt/kafka/bin/kafka-console-consumer.sh --bootstrap-server 192.168.1.230:9092 --topic ams-instance-stats --from-beginning
Output:
{"instanceId":"a06e5437-40ee-49c1-8e38-273544964335","cpuUsage":{"processCPUTime":596700000,"systemCPULoad":0,"processCPULoad":1},"jvmMemoryUsage":{"maxMemory":260046848,"totalMemory":142606336,"freeMemory":21698648,"inUseMemory":120907688},"systemInfo":{"osName":"Linux","osArch":"amd64","javaVersion":"1.8","processorCount":1},"systemMemoryInfo":{...}}
Some Useful Apache Kafka commands
- List all topics:
/opt/kafka/bin/kafka-topics.sh --list --bootstrap-server your_kafka_server:9092
- Monitor messages for a specific topic:
/opt/kafka/bin/kafka-console-consumer.sh --bootstrap-server 192.168.1.230:9092 --topic ams-instance-stats --from-beginning
Install Elasticsearch and Logstash
Install Elasticsearch
- Import GPG key and Repo:
wget -qO - https://artifacts.elastic.co/GPG-KEY-elasticsearch | sudo apt-key add -
sudo apt-get install apt-transport-https
echo "deb https://artifacts.elastic.co/packages/7.x/apt stable main" | sudo tee -a /etc/apt/sources.list.d/elastic-7.x.list
- Update package lists and install:
sudo apt-get update && sudo apt-get install elasticsearch
- Enable and start Elasticsearch service:
sudo systemctl enable elasticsearch.service
sudo systemctl start elasticsearch.service
Install Logstash
- Install Logstash:
sudo apt-get update && sudo apt-get install logstash
- Enable Logstash:
sudo systemctl enable logstash.service
- Configure Logstash:
vim /etc/logstash/conf.d/logstash.conf
Content:
input {
  kafka {
    bootstrap_servers => "kafka_server_ip:9092"
    client_id => "logstash"
    group_id => "logstash"
    consumer_threads => 3
    topics => ["ams-instance-stats","ams-webrtc-stats","kafka-webrtc-tester-stats"]
    codec => "json"
    tags => ["log", "kafka_source"]
    type => "log"
  }
}

output {
  elasticsearch {
     hosts => ["127.0.0.1:9200"] #elasticsearch_ip
     index => "logstash-%{[type]}-%{+YYYY.MM.dd}"
  }
  stdout { codec => rubydebug }
}
- Restart Logstash:
sudo systemctl restart logstash
Test Elasticsearch and Logstash
curl -XGET 'localhost:9200/_cat/indices?v&pretty'
Install Grafana
- Install Grafana:
sudo apt-get install -y software-properties-common wget apt-transport-https
wget -q -O - https://packages.grafana.com/gpg.key | sudo apt-key add -
sudo add-apt-repository "deb https://packages.grafana.com/oss/deb stable main"
sudo apt-get update && sudo apt-get install grafana
- Enable and start Grafana:
sudo systemctl enable grafana-server
sudo systemctl start grafana-server
Configure Grafana
- Login:
http://your_ip_address:3000/login(default: admin/admin). - Add data source → Select Elasticsearch.
- Configure:
URL : http://127.0.0.1:9200
Index name: logstash-*
Time field name: @timestamp
Version: 7.0+
- Create a dashboard and queries.
Download the example dashboard: antmedia-dashboard.json
Create Telegram Alert
Follow steps with @BotFather and Grafana Notification Channels to integrate alerts into Telegram.
Enable SSL
Use Nginx + Certbot to enable HTTPS. (Configuration steps provided above).
Performance Tuning
Tune heap size, pipeline workers, Kafka partitions, and Logstash logging based on your server capacity.
Congratulations!
You now have a complete monitoring solution for your Ant Media Server cluster.
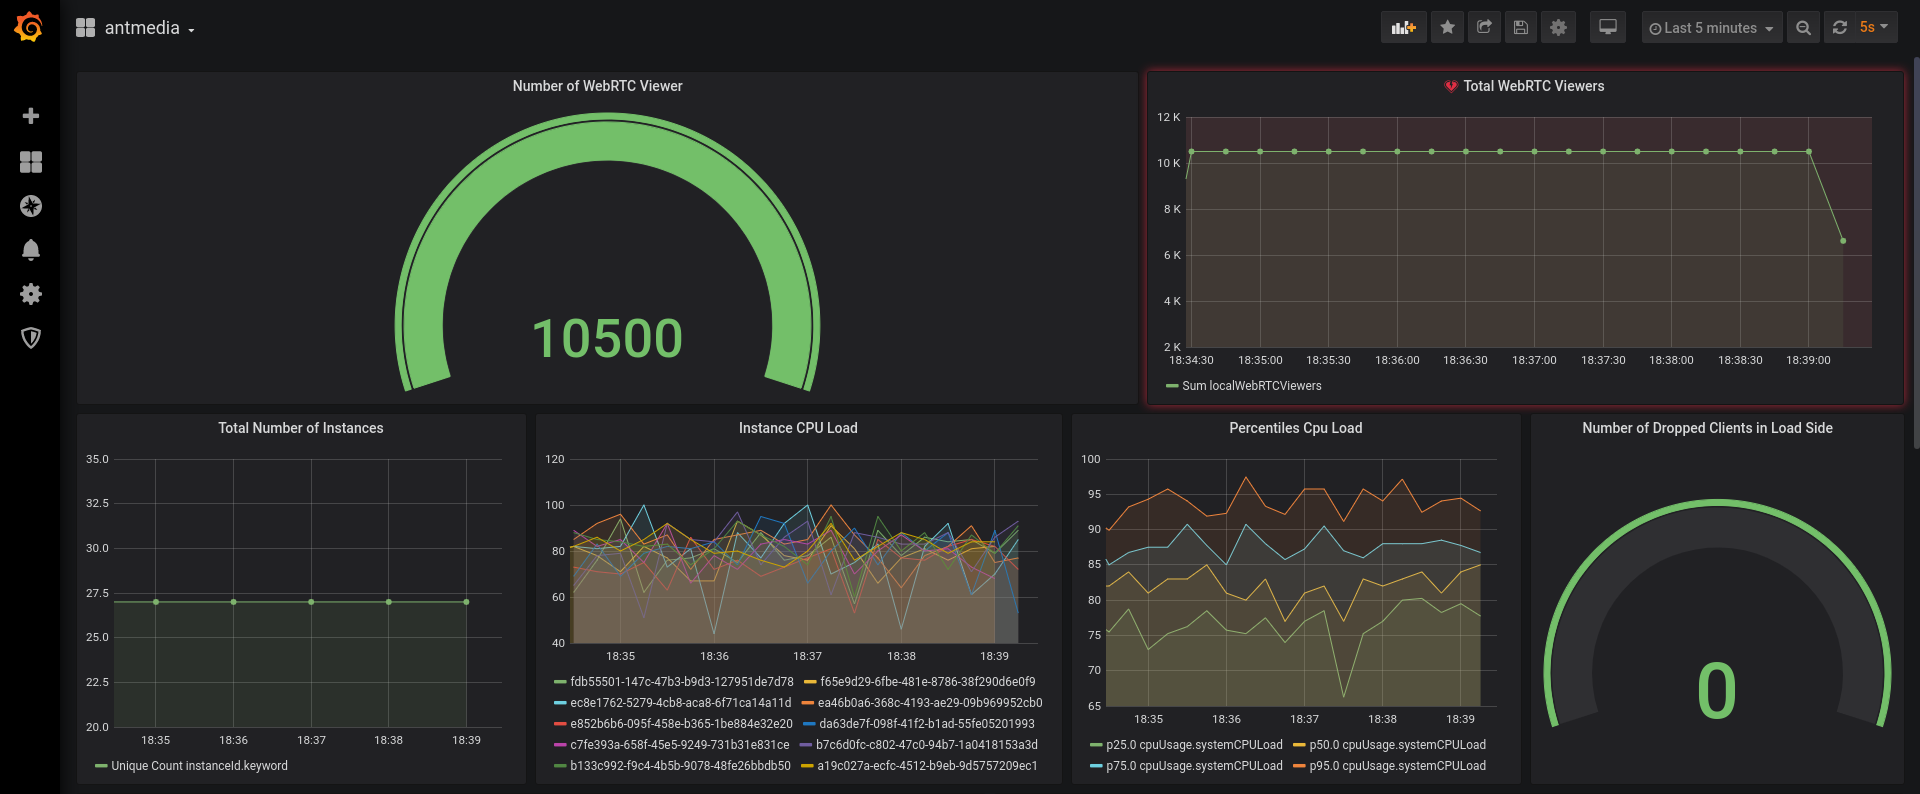
If you’ve followed all the steps, your Ant Media Server metrics should now be flowing into Grafana. You’ll be able to visualize CPU usage, memory stats, stream counts, and more in real time.
From here, you can:
-
Build custom dashboards for deeper insights into AMS performance.
-
Use queries and visualizations to monitor system health and streaming metrics.
-
Set up alerts (for example, via Telegram) to get notified when thresholds are exceeded.