Collecting Logs and Metrics of Ant Media Server on Kubernetes
Centralized collection, monitoring, and analysis of Ant Media Server logs and system metrics running on Kubernetes is critically important. This document explains how to configure it using two main components:
- Loki: For collecting and monitoring Ant Media Server application logs on a centralized logging system.
- Prometheus: For monitoring Kubernetes cluster metrics.
Both systems will be integrated with Grafana for visualization. In the following sections, the installation and configuration of Loki and Prometheus, along with sample configurations specific to Ant Media Server, will be explained step by step.
2. Collecting Ant Media Server Logs: Using Loki
2.1. What is Loki?
Brief description: A lightweight log collection and query system developed by Grafana Labs, compatible with Kubernetes.
Since Ant Media Server default Kubernetes manifest files already include log configuration, no additional settings are required.
2.2. Installing Loki
Installing Loki via Helm:
helm repo add grafana https://grafana.github.io/helm-charts
helm repo update

helm install loki grafana/loki-stack \
  --namespace monitoring \
  --set grafana.enabled=false \
  --set promtail.enabled=true \
  --set prometheus.enabled=false \
  --set loki.persistence.enabled=true \
  --set loki.persistence.size=5Gi \
  --set loki.persistence.storageClassName=default
2.3. Defining and Configuring Loki Datasource
Add the datasource as shown below:
apiVersion: v1
kind: ConfigMap
metadata:
  name: loki-grafana-datasource
  namespace: monitoring
  labels:
    grafana_datasource: "1"
data:
  loki-datasource.yaml: |
    apiVersion: 1
    datasources:
      - name: Loki
        type: loki
        access: proxy
        url: http://loki:3100
        isDefault: false
3. Installing Prometheus
3.1. What is Prometheus?
A system used for collecting cluster health status and application metrics.
3.2. Installing Prometheus
Installing Prometheus via Helm
helm repo add prometheus-community https://prometheus-community.github.io/helm-charts
helm repo update

helm install prometheus prometheus-community/kube-prometheus-stack \
  --namespace monitoring \
  --create-namespace \
  --set alertmanager.enabled=true \
  --set grafana.enabled=true \
  --set grafana.sidecar.datasources.enabled=true \
  --set grafana.persistence.enabled=true \
  --set grafana.persistence.size=5Gi \
  --set grafana.persistence.storageClassName=default \
  --set grafana.service.type=LoadBalancer \
  --set prometheus.prometheusSpec.storageSpec.volumeClaimTemplate.spec.storageClassName=default \
  --set prometheus.prometheusSpec.storageSpec.volumeClaimTemplate.spec.resources.requests.storage=10Gi \
  --set alertmanager.alertmanagerSpec.storage.volumeClaimTemplate.spec.storageClassName=default \
  --set alertmanager.alertmanagerSpec.storage.volumeClaimTemplate.spec.resources.requests.storage=5Gi \
  --set grafana.adminPassword='your-password'
Retrieving Grafana Admin Password
Once the installation is complete, run the following command and make a note of the password for Grafana:
kubectl --namespace monitoring get secrets prometheus-grafana -o jsonpath="{.data.admin-password}" | base64 -d ; echo
Retrieving Grafana Service IP Information
Run the following command, note the IP address, and log in to Grafana using it:
Example: http://IP_Address
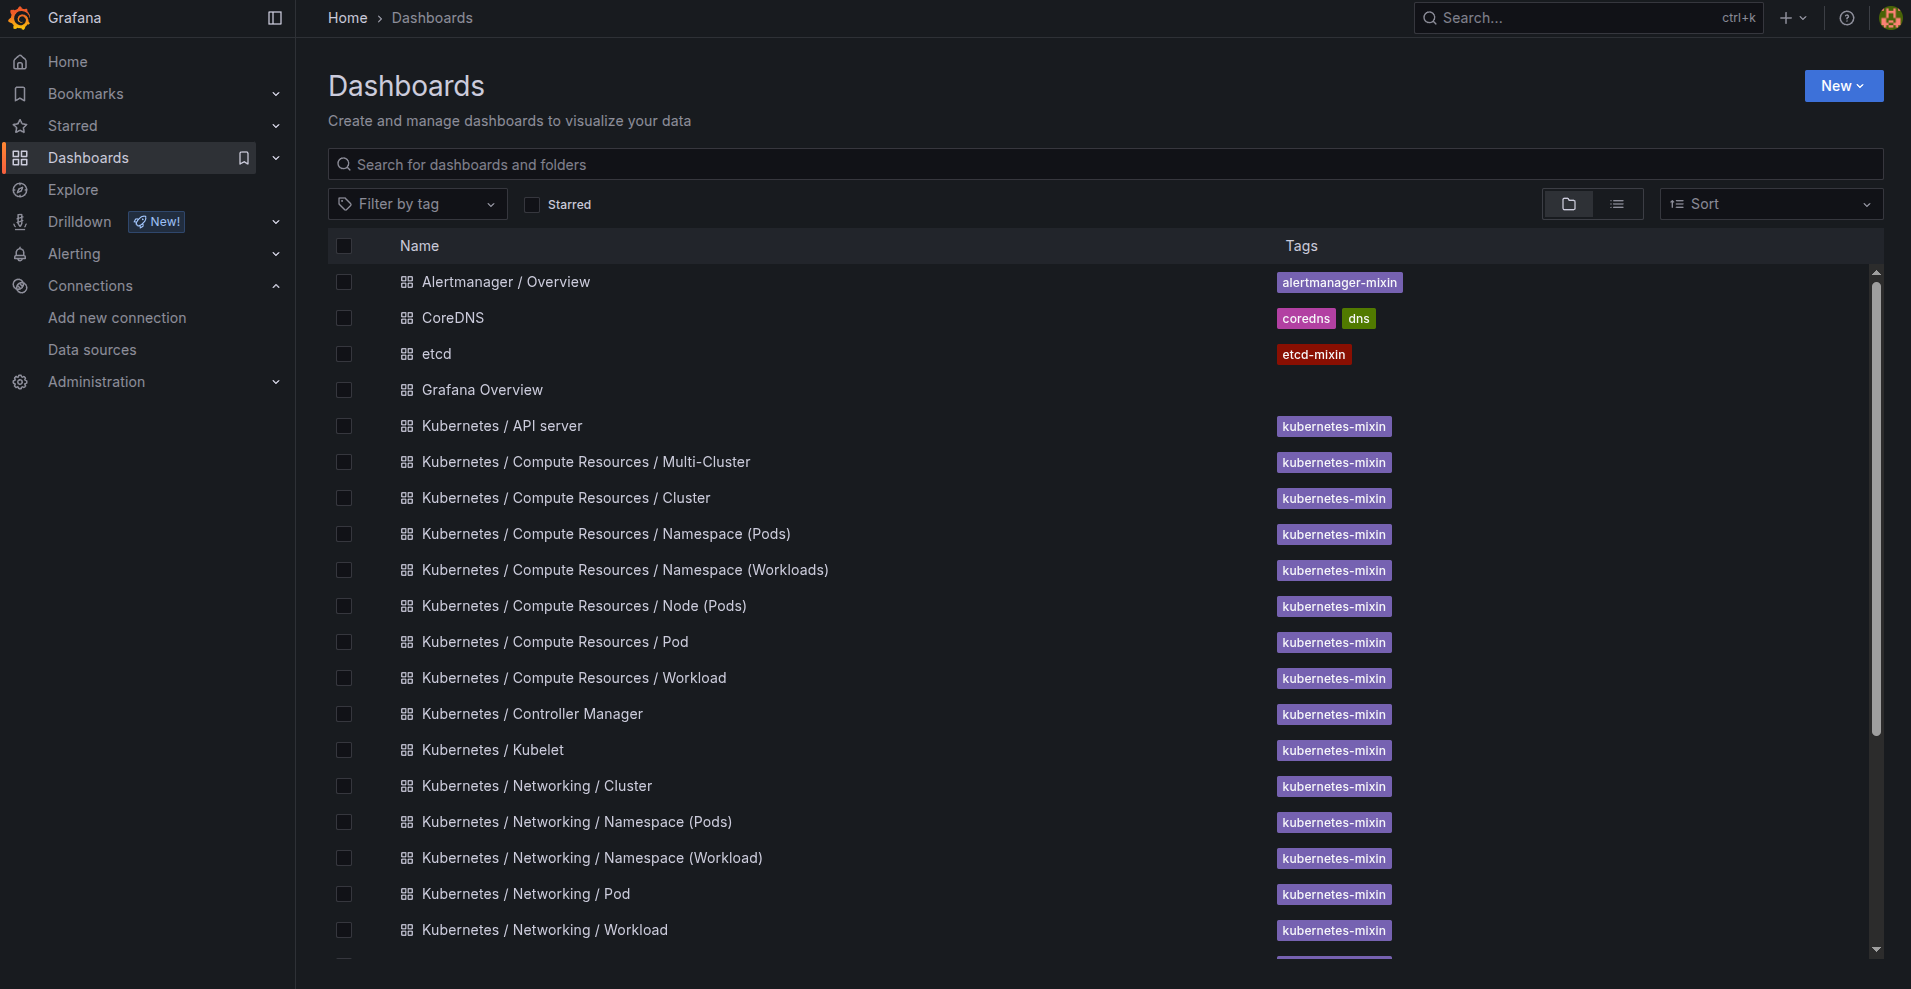
You will see the dashboards like the one below.
kubectl get svc -n monitoring prometheus-grafana
4. Setting Up the Dashboard
To view the logs, let's add a dashboard:
- Log in to the Grafana interface.
- Go to Dashboards > New > Import
- Enter
15141as the Dashboard ID and load it. - You will see a screen like the one below.
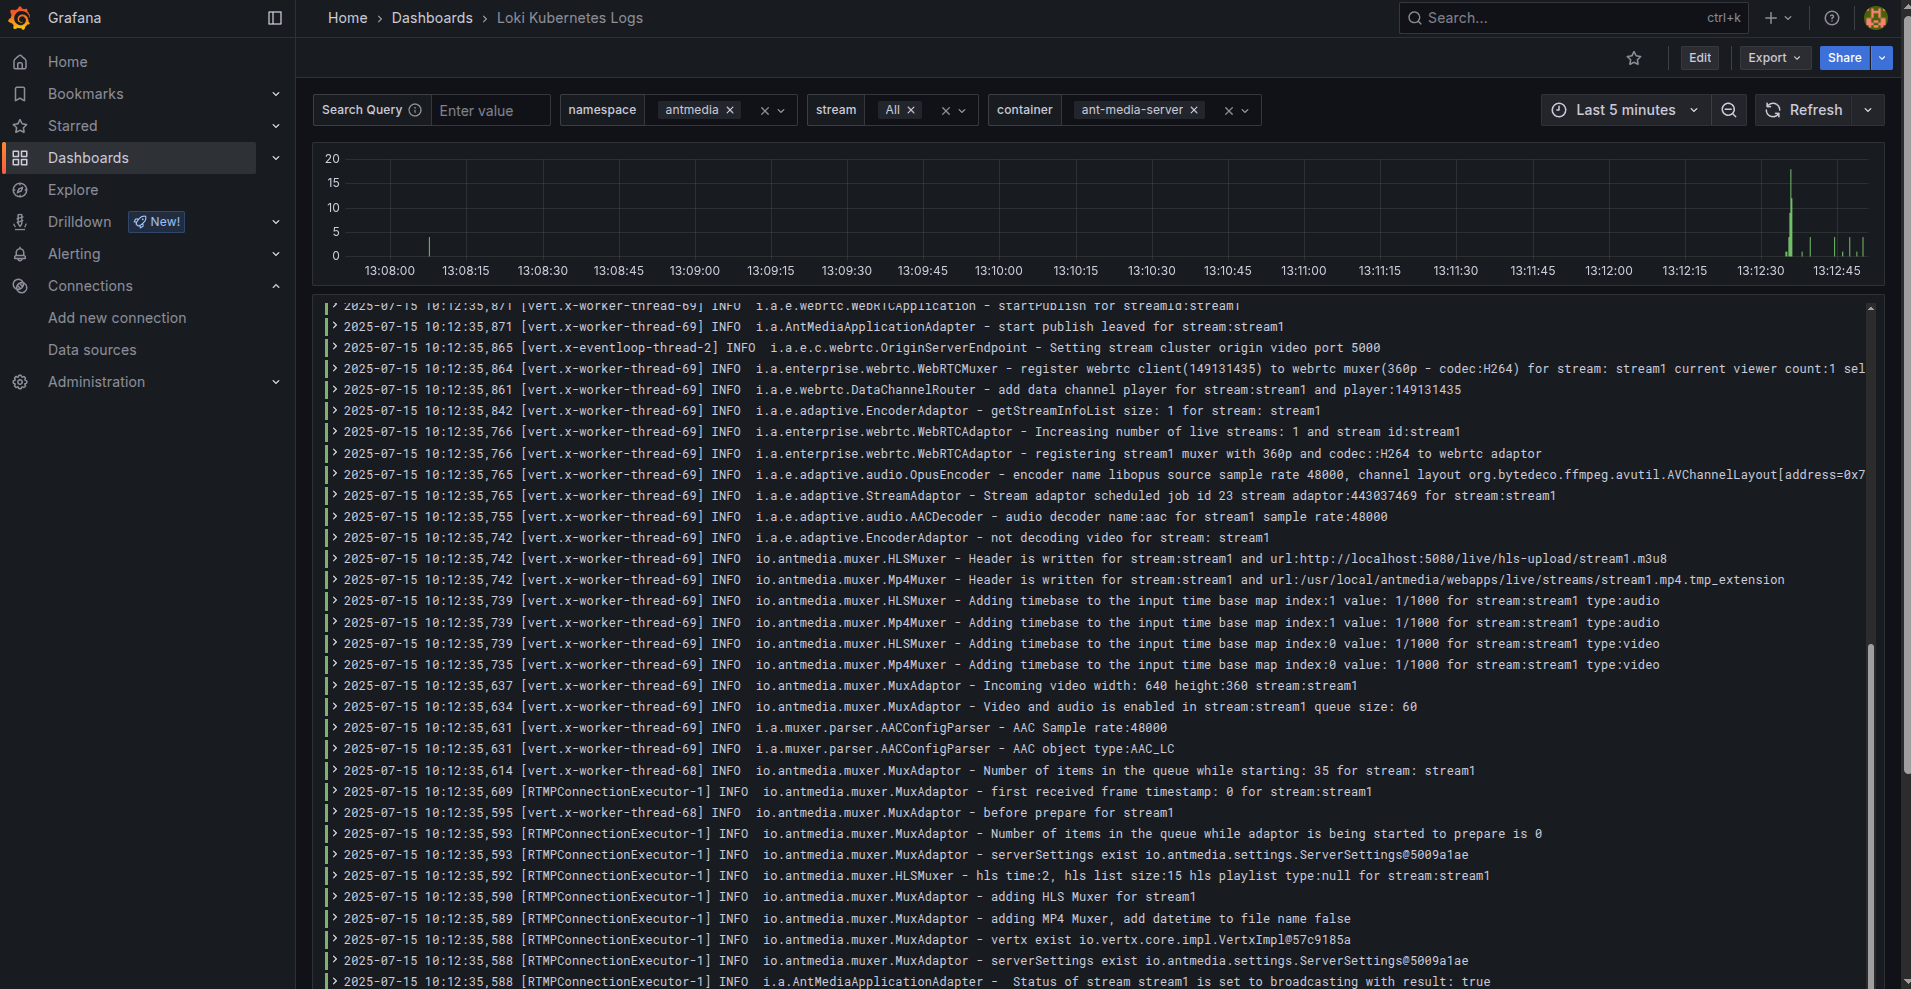
You will now be able to easily monitor Ant Media Server pod logs.