Monitor Ant Media Server statistics with New Relic
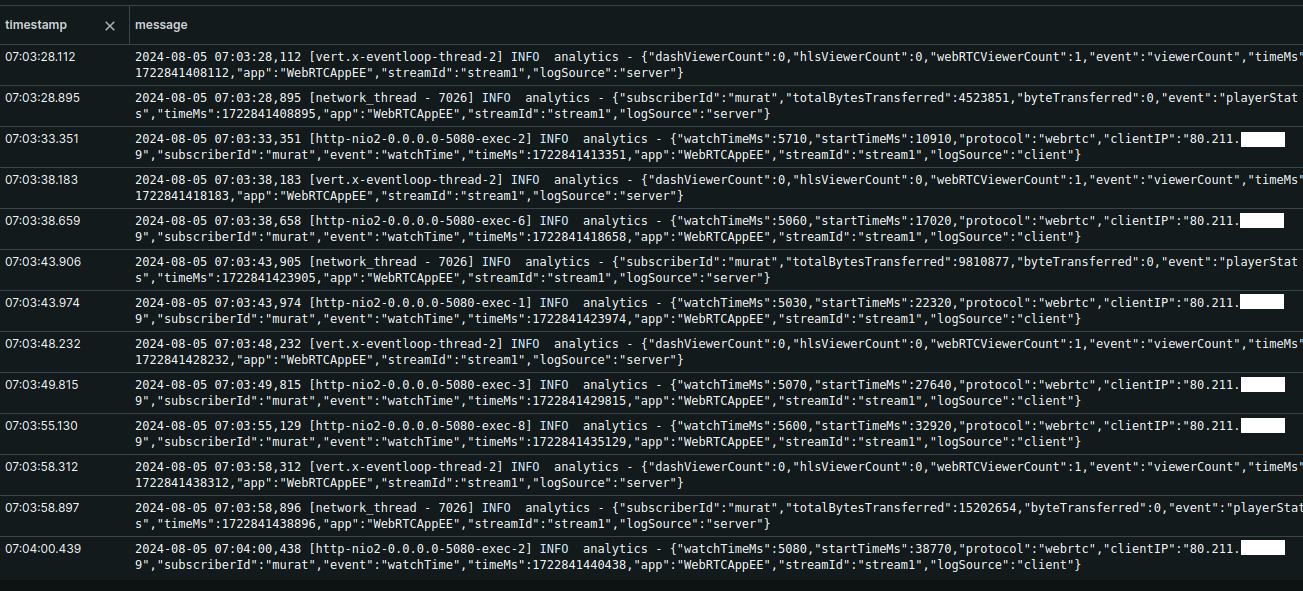
Starting with v2.10.0, Ant Media Server (AMS) provides analytics logs to monitor important usage and performance statistics.
These logs are stored in JSON format at: ant-media-server-analytics.log.
This makes it possible to forward logs to external platforms such as New Relic for visualization and monitoring.
Metrics Available in Analytics Logs
- Total data transfer per user
- Publisher statistics (streamId, application name, codecs, height, width, resolution, etc)
- WebRTC, HLS and DASH viewer count
- Publishing and playing start/end times
- Subscriber IDs and statistics
- Tokens
- Stream duration
- Key Frame Interval per stream
These metrics help analyze performance, monitor usage, and improve the streaming experience.
Installation and Use of New Relic
New Relic is a software analytics and performance monitoring platform that helps monitor and optimize applications and infrastructure in real-time. It provides detailed insights into the performance, reliability, and scalability of web applications, microservices, and cloud infrastructure.
After creating and logging into your New Relic account, follow these steps to configure and install the New Relic Client on the server where your Ant Media Server is installed.
New Relic Client Installation
Select from the side bar, All Entities > Add Data > Linux Logs > Create a new key
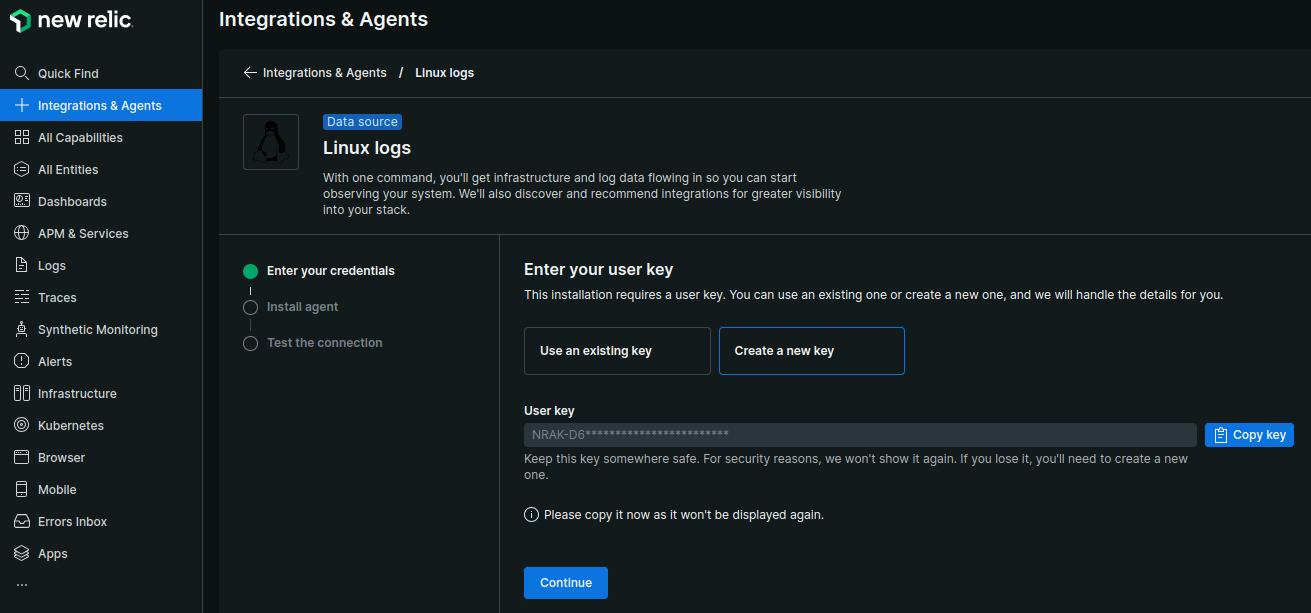
- Copy the command and install the Agent on the instance where Ant Media Server installed.
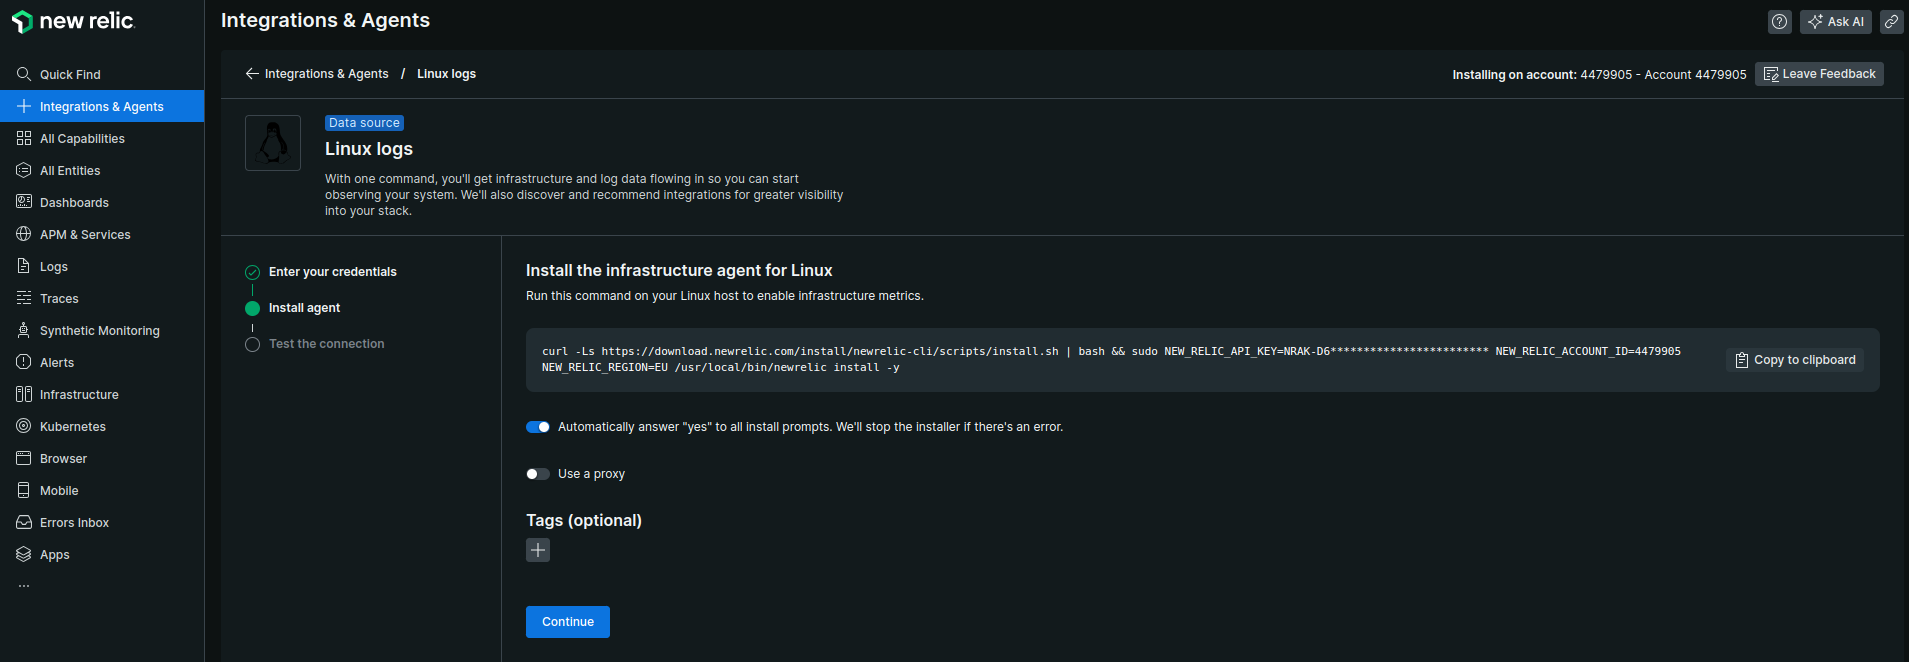
curl -Ls https://download.newrelic.com/install/newrelic-cli/scripts/install.sh | bash && sudo NEW_RELIC_API_KEY=NRAK-************YI91R NEW_RELIC_ACCOUNT_ID=44799 NEW_RELIC_REGION=EU /usr/local/bin/newrelic install -y
Configuration of Log File
To process only Ant Media Server's Analytics logs in New Relic, delete all the YAML files under /etc/newrelic-infra/logging.d folder and create a new file named antmedia.yaml with the following lines:
logs:
  - name: antmedia
    file: /var/log/antmedia/ant-media-server-analytics.log
    attributes:
      logtype: custom
Restart the New Relic infrastructure service to activate the configuration:
sudo systemctl restart newrelic-infra.service
Once you complete these steps, your logs will start being transferred to New Relic.
Log Parsing
We need to add log parse on New Relic to process logs for each event. You can perform a parsing process suitable for your log format using the log parsing tools provided by New Relic. This step is critical for correctly interpreting and analyzing your logs.
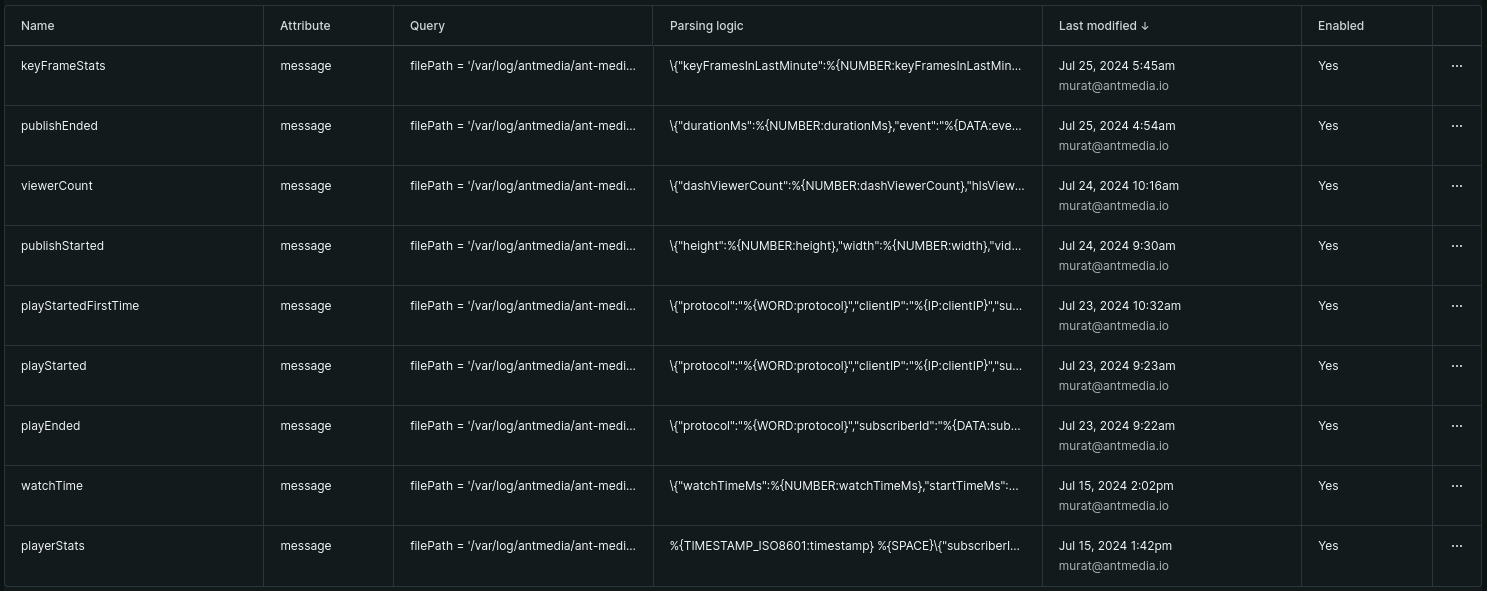
Let's create the rules by clicking Logs > Parsion Logs > Create parsin rule. Unfortunately, there is no Import/Export feature in New Relic Parsing Rules, so you need to create the parsing rule for each event manually, as below:
- Please make sure that their is no blank space in the fields while creating the parsing rules.
- You can also create more parsing rules and dashboard charts according to the analytics log entries.
- The parsing rule format and the original log entry format in analytics logs should be matched for correct logging and data fetching.
Name: keyFrameStats
Field to parse: messages
Filter logs based on NRQL: filePath = '/var/log/antmedia/ant-media-server-analytics.log'
Parsing rule: \{"keyFramesInLastMinute":%{NUMBER:keyFramesInLastMinute},"keyFrameIntervalMs":%{NUMBER:keyFrameIntervalMs},"event":"%{DATA:event}","timeMs":%{NUMBER:timeMs},"app":"%{DATA:app}","streamId":"%{DATA:streamId}","logSource":"%{DATA:logSource}"\}

Name: publishEnded
Field to parse: messages
Filter logs based on NRQL: filePath = '/var/log/antmedia/ant-media-server-analytics.log'
Parsing rule: \{"durationMs":%{NUMBER:durationMs},"event":"%{DATA:event}","timeMs":%{NUMBER:timeMs},"app":"%{DATA:app}","streamId":"%{DATA:streamId}","logSource":"%{DATA:logSource}"\}

Name: viewerCount
Field to parse: messages
Filter logs based on NRQL: filePath = '/var/log/antmedia/ant-media-server-analytics.log'
Parsing rule: \{"dashViewerCount":%{NUMBER:dashViewerCount},"hlsViewerCount":%{NUMBER:hlsViewerCount},"webRTCViewerCount":%{NUMBER:webRTCViewerCount},"event":"%{DATA:event}","timeMs":%{NUMBER:timeMs},"app":"%{DATA:app}","streamId":"%{DATA:streamId}","logSource":"%{DATA:logSource}"\}

Name: publishStarted
Field to parse: messages
Filter logs based on NRQL: filePath = '/var/log/antmedia/ant-media-server-analytics.log'
Parsing rule: \{"height":%{NUMBER:height},"width":%{NUMBER:width},"videoCodec":"%{DATA:videoCodec}","audioCodec":"%{DATA:audioCodec}","protocol":"%{WORD:protocol}","event":"%{DATA:event}","timeMs":%{NUMBER:timeMs},"app":"%{DATA:app}","streamId":"%{DATA:streamId}","logSource":"%{DATA:logSource}"\}

Name: playStartedFirstTime
Field to parse: messages
Filter logs based on NRQL: filePath = '/var/log/antmedia/ant-media-server-analytics.log'
Parsing rule: \{"protocol":"%{WORD:protocol}","clientIP":"%{IP:clientIP}","subscriberId":"%{DATA:subscriberId}","event":"%{DATA:event}","timeMs":%{NUMBER:timeMs},"app":"%{DATA:app}","streamId":"%{DATA:streamId}","logSource":"%{DATA:logSource}"\}

Name: playStarted
Field to parse: messages
Filter logs based on NRQL: filePath = '/var/log/antmedia/ant-media-server-analytics.log'
Parsing rule: \{"protocol":"%{WORD:protocol}","clientIP":"%{IP:clientIP}","subscriberId":"%{DATA:subscriberId}","event":"%{DATA:event}","timeMs":%{NUMBER:timeMs},"app":"%{DATA:app}","streamId":"%{DATA:streamId}","logSource":"%{DATA:logSource}"\}

Name: playEnded
Field to parse: messages
Filter logs based on NRQL: filePath = '/var/log/antmedia/ant-media-server-analytics.log'
Parsing rule: \{"protocol":"%{WORD:protocol}","subscriberId":"%{DATA:subscriberId}","event":"%{DATA:event}","timeMs":%{NUMBER:timeMs},"app":"%{DATA:app}","streamId":"%{DATA:streamId}","logSource":"%{DATA:logSource}"\}

Name: watchTime
Field to parse: messages
Filter logs based on NRQL: filePath = '/var/log/antmedia/ant-media-server-analytics.log'
Parsing rule: \{"watchTimeMs":%{NUMBER:watchTimeMs},"startTimeMs":%{NUMBER:startTimeMs},"protocol":"%{WORD:protocol}","clientIP":"%{IP:clientIP}","subscriberId":"%{DATA:subscriberId}","event":"%{DATA:event}","timeMs":%{NUMBER:timeMs},"app":"%{DATA:app}","streamId":"%{DATA:streamId}","logSource":"%{DATA:logSource}"\}

Name: playerStats
Field to parse: messages
Filter logs based on NRQL: filePath = '/var/log/antmedia/ant-media-server-analytics.log'
Parsing rule: \{"subscriberId":"%{USERNAME:subscriberId}","totalBytesTransferred":%{INT:totalBytesTransferred},"byteTransferred":%{INT:byteTransferred},"event":"%{WORD:event}","timeMs":%{NUMBER:timeMs},"app":"%{WORD:app}","streamId":"%{USERNAME:streamId}","logSource":"%{WORD:logSource}"\}
Dashboard creation
We have done the hardest part, now you just need to import the dashboard from here under Dashboard > Import dashboard.
Please do not forget to change the account ID of your New Relic account in the json.
"accountIds": [ 0000000 //replace your account ID in whole json ],
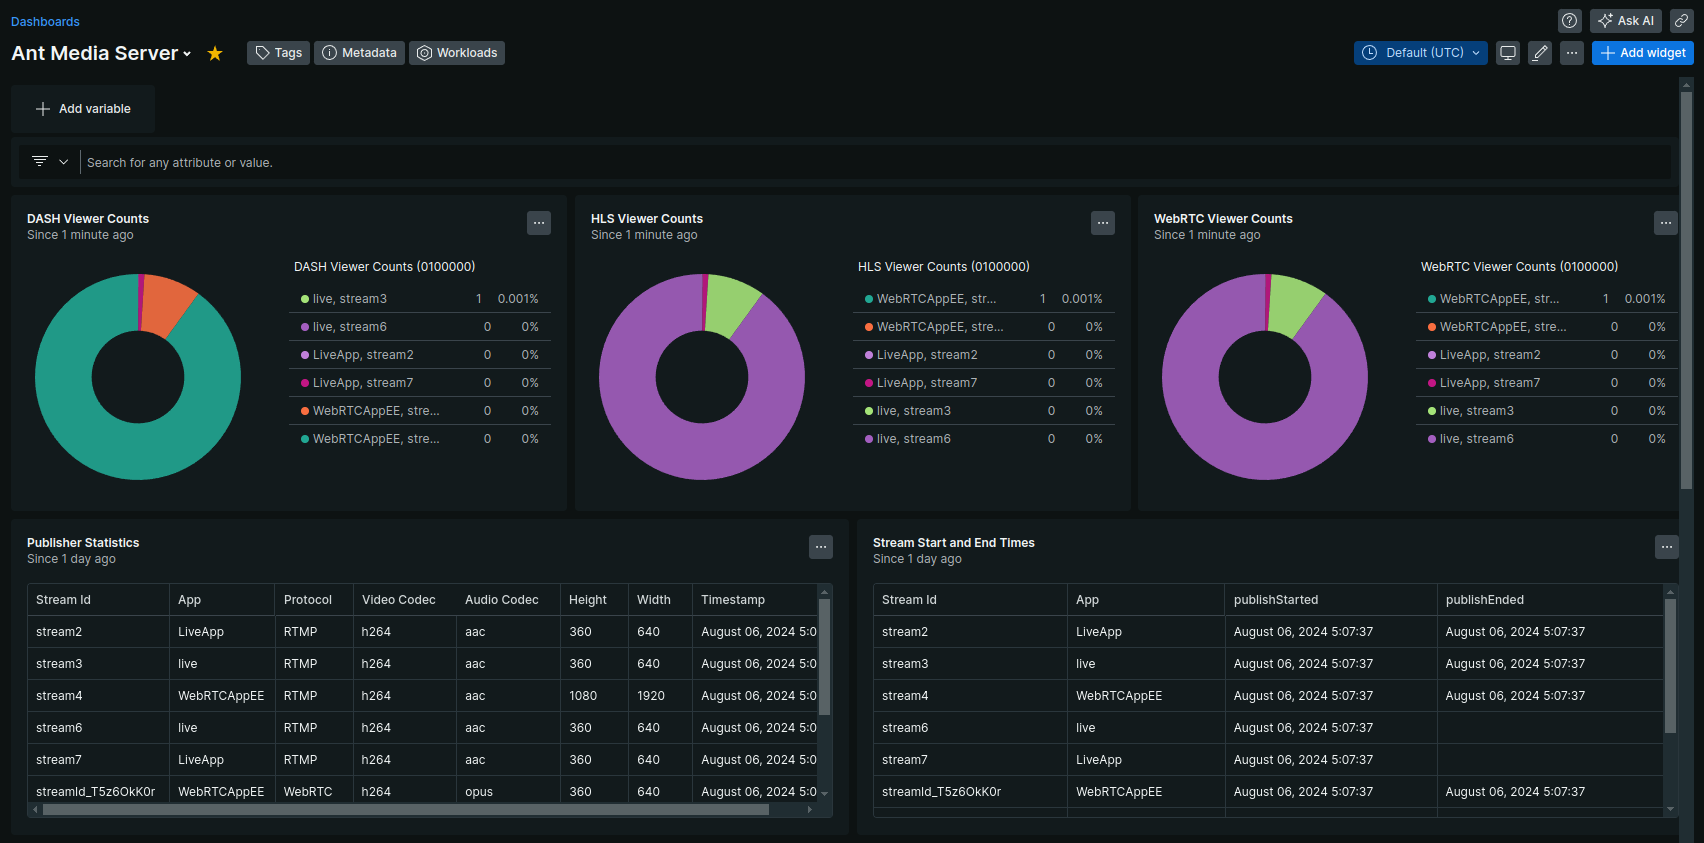
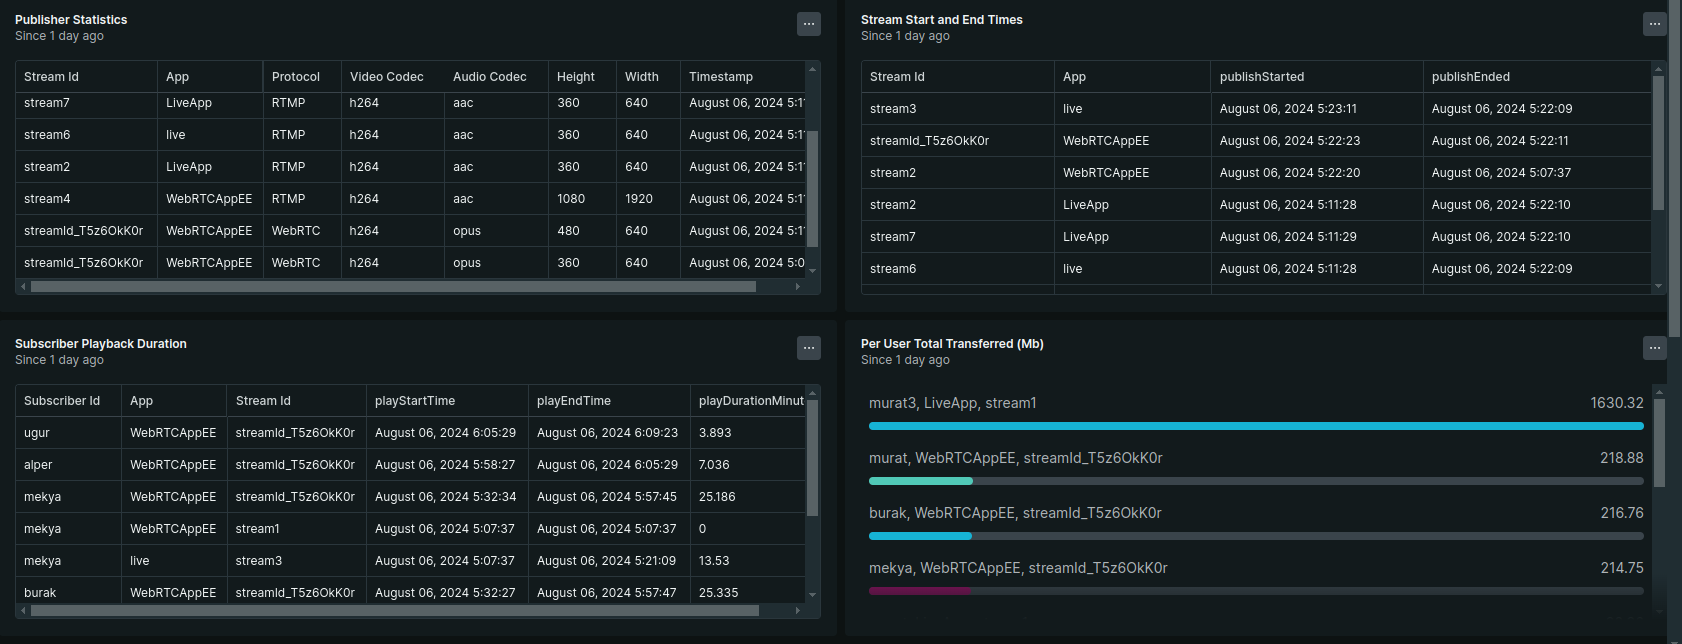
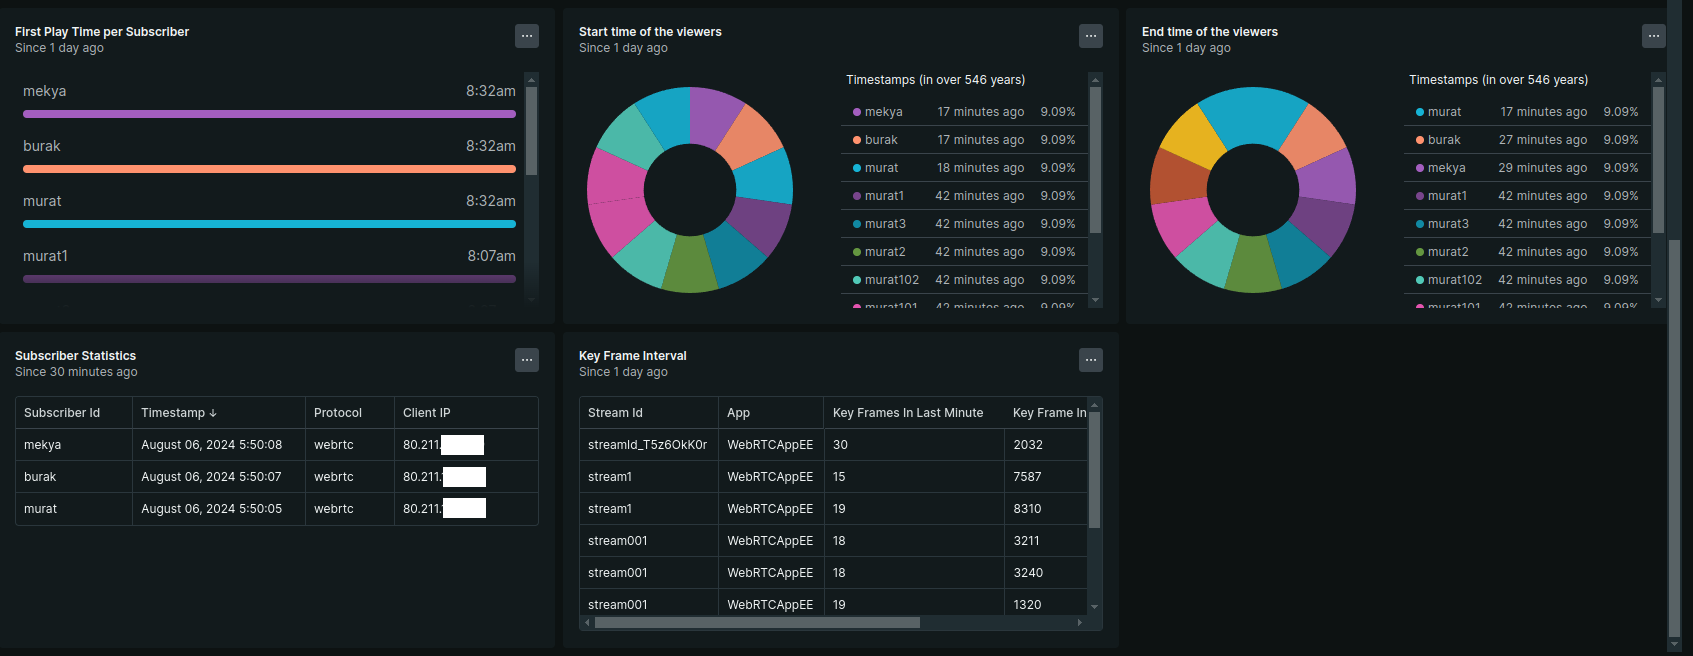
If you wish, you can customize the dashboard according to your preferences by using NRQL queries.
Congratulations!
You’ve successfully integrated Ant Media Server with New Relic
Now you can:
-
Monitor publishing and viewing trends in real time.
-
Track data transfer and keyframe performance.
-
Detect anomalies or playback issues before your users notice.
-
Build custom dashboards tailored to your workflow.
This is just the first iteration you can expand parsing rules, enhance dashboards, and fine-tune monitoring as your streaming projects grow.